Friday, August 23, 2013

SAS Server Pages in Batch - Adding a BY variable to the tagCloud macro

In my last post, SAS Server Pages in Batch? Absolutely!, I talked about how SAS Server Pages could be used in batch (e.g., SAS Display Manager, SAS Enterpreise Guide, scheduled SAS processes, etc.). I presented a macro, tagCloud, that could produce a graphical display of BI data.

This post extends the macro to include a single BY variable so a separate tag cloud is produced for each value of the BY variable. This example macro produces a single HTML page with multiple tag clouds. The macro could easily be modified to produce a separate HTML for each value of the BY variable. I will leave that as an exercise for the reader ;-).

A sample macro call, along with the complete source for the macro is included below, with the changes highlighted in red.

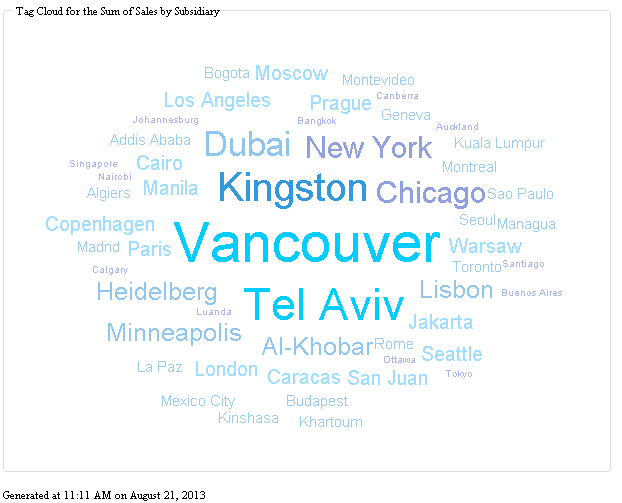
First, here is the macro call. Assuming you save the tagCloud macro in a SAS autocall library, you can produce tag clouds with these two lines of code. In my last example I produced a tag cloud where the variable Subsidiary was the CLASS variable. Here I am producing a separate tag cloud for each Region, with Product used as the CLASS variable.

filename _webout "&root\Output\TagCloud-By-Region.html";
%tagCloud(word=Product,weight=Sales,by=Region)

First, three simple additions to the macro:
  1. A macro parameter for the BY variable is added. It defaults to null. If not provided, the macro produces the same output shown in SAS Server Pages in Batch? Absolutely!.
  2. Added a few macro variables to our local list - a Best Practice to make such utility macro variables local.
  3. Add the BY variable to the summary step so we have the statistic calculated for each combination of the BY and CLASS (the word macro parameter) variables.
%macro tagCloud(data = sashelp.shoes  /* input data */
               ,by =                  /* by variable to use */
               ,where = 1             /* subset where clause */
               ,word = Subsidiary     /* class variable */
               ,weight = Sales        /* analysis variable */
               ,statistic = Sum       /* statistics to calculate */
               ,outfile = _webout     /* output fileref */
               ,width = 600px         /* width of the tag cloud */
               ,height = 450px        /* height of the tag cloud */
               );

 %local byTitle numByGroups pageTitle pageHeader nl;

 proc summary data = &data nway;
  where &where;
  class &by &word;
  var &weight;
  output out=cloud(drop=_type_ _freq_) &statistic=;
 run;

If a BY variable is specified, get the list of distinct values and populate values for:
  1. numByGroups - note that a value of 1 is assigned if there is no BY variable specified. We need to generate just one tag cloud.
  2. pageTitle - the text for the HMTL TITLE tag. A macro variable is used since the values depends on whether or not a BY variable is specified and what the value of the BY variable is.
  3. pageHeader - Some text to use for a title/banner at the top of the page. Note that a value is only provided if there is a BY variable.
 %if %length(&by) gt 0 %then
 %do;  /* produce a separate tag cloud for each value of the by variable */
    proc sql noprint;
     select distinct &by into :by1-:by999 from cloud;
    quit;
    %let numByGroups = &sqlobs;
    %let pageTitle = Tag Clouds for each &by for the &statistic of &weight by &word;
    %let pageHeader = <h3>&pageTitle</h3>; 
 %end;
 %else
 %do;
    %let numByGroups = 1;
    %let pageTitle = Tag Cloud for the &statistic of &weight by &word;
 %end;

Call PROC STREAM to create the  HEAD section of the HTML (top_matter in SAS ODS terminology) along with the beginnings of the BODY section. The macro variable pageTitle is used to provide the value for the value for the HTML title attribute

 proc stream outfile = &outfile quoting = both;
 BEGIN
%let nl = &streamDelim newline;
&nl;<html>
&nl; <head>
&nl;  <title>&pageTitle</title>
&nl;  <script src="&GoogleApiLib/jquery/1.10.1/jquery.min.js"> </script>
&nl;  <script src="&GoogleApiLib/libs/jqueryui/1.10.3/jquery-ui.min.js"></script>
&nl;  <style>&streamDelim readfile srvrpgs(jqcloud.css);</style>
&nl;  <script>&streamDelim readfile srvrpgs(jqcloud-1.0.3.js);</script>
&nl; </head>
&nl; <body>

Add the pageHeader text (note that the value is null if there is no BY variable). Then end the current PROC STREAM invocation as we need to use a macro loop to use PROC STREAM generate the HTML and JavaScript for each BY group.

&nl;&pageHeader
;;;;

First reassign the output fileref so additional content is appended to it. Without the mod option, the file would be over-written.Then use a macro %DO loop to execute PROC STREAM once for each value of the BY variable. If there is no BY variable we still execute the code in the loop once.
  • The macro parameter, where, is re-used to specify the where clause for the current by group.
  • The byTitle macro variable contains the text for the current by group (it's use is described below).
  • Note that a where clause of 1 (always true) is used if there is no BY variable
  • Likewise, the byTitle macro variable contains the same text (&pageTitile) as is used for the HTML TITLE tag when there is no BY variable.

    filename &outfile "%sysfunc(pathname(&outfile))" mod;
    %do i = 1 %to &numByGroups;
       %if %length(&by) gt 0 %then
       %do;
          %let where = &by="&&by&i";
          %let byTitle = &&by&i;
       %end;
       %else
       %do; 
          %let where = 1;
          let byTitle = &pageHeader;
       %end;

Invoke PROC STREAM.

       proc stream outfile = &outfile quoting = both;
       BEGIN
%let nl = &streamDelim newline;

There are only a few changes in the HTML and JavaScript code:
  1. A margin attribute is used to provide some space so the regions for the tag clouds have some white space between them. Note that the float:left allows the output to wrap to a new row only when needed.
  2. The byTitle macro variable (defined above) is used to provide the title text displayed in the border of each tag cloud.
  3. In order for the id value for the region used for the tag cloud, as well as for the name of the JSON variable containing the tag cloud data, to be unique, we suffix the name with &i.
&nl;<div style="float:left; width:&width; height:&height; margin:5px;">
&nl;<fieldset><legend style="font-size:70%;">&byTitle</legend>
&nl;<div id="cloudCanvas&i" style="width:&width; height:&height;"></div>
&nl;</fieldset></div>
&nl;<script>
&nl; var tagCloud&i
&nl; %tagCloudJSON(data=cloud
                  ,word=&word
                  ,weight=&weight
                  ,where=&where
                  )
&nl; $(function() {
&nl;   $("#cloudCanvas&i").jQCloud(tagCloud&i);
&nl; });
&nl;</script>
;;;;
    %end;

After exiting the macro %DO loop we close use PROC STREAM to write the footer text and HTML (e.g., bottom_matter in SAS ODS terminology).

 proc stream outfile = &outfile quoting = both;
 BEGIN
%let nl = &streamDelim newline;
&nl;<div style="clear:both; font-size:70%;">%generatedAt()</div>
&nl; </body>
&nl;</html>
 ;;;;
%mend tagCloud;

And for those of you who want to download the code, I have a few more examples to blog about. Once I do that, I will package up all the pieces and parts (e.g., the AJAX container, the tag clouds SAS Server Pages, the macros, etc.) as a zip file.

Wednesday, August 21, 2013

SAS Server Pages in Batch? Absolutely!

The origins of SAS Server Pages, and thus the name, as discussed in this blog posting, was to simplify the generation of HTML in Stored Processes and SAS/IntrNet Application Dispatcher programs.

When I started work on my my eBook, SAS Server Pages: Generating Dynamic Content, I was presented with a conflict. SAS Server Pages could also be used in batch processing that did not involve any of the SAS web applications or tools. So, do I try come up with a new/better name???? After consulting colleagues who were using SAS Server Pages, the consensus was no. Just make sure to provide examples that show their use in batch processing. What I decided to do in the book and now in this blog entry (and more blog entries to follow), was to take their advice and provide batch examples.

But first let me be clear about what I mean by in batch:
  • jobs run on a scheduled or ad-hoc basis in the background (e.g., overnight job to produce reports).
  • code submitted interactively by a SAS user/programmer in SAS Display Manager.
  • code submitted interactively by a SAS user/programmer in SAS Enterprise Guide.

The example here is a Tag Cloud example and uses basically the same SAS Server Page components as discussed in Tag Cloud SAS Server Page Components. The SAS Server Page shown here has some changes/improvements over what was shown there for a number of reasons:
  • to leverage the environment in which the code is being run.
  • to highlight some features of PROC STREAM.
  • and, of course, whenever you revisit some code, it is quite common to come up with ideas to improve it.

The code has been packaged as a macro. There isn't any conditional or iterative processing (though in my post I will add conditional and iterative capabilities to the macro in order to support a BY variable). Plus, as a Best Practice I like to use macros to simply package and parameter code.

So producing this tag cloud output:


was accomplished by calling the following macro (stored in a macro autocall library).

As a convention I typically use _webout for the fileref even in batch programs. By doing that, any of my programs can easily be used in a Stored Process or SAS/IntrNet Application Dispatcher program.

filename _webout "&root\Output\TagCloud.html";
%tagCloud(data = sashelp.shoes
         ,word = Subsidiary
         ,weight = Sales
         )

So once the macro is made available via an autocall library, anyone can use it to create graphical displays of BI data as a tag cloud.

Lets now look at the macro. As stated above most of the SAS code and HTML was discussed in Tag Cloud SAS Server Page Components. This blog post will focus on the changes.
  • I provide default values for all the parameters. This is done for demo purposes only.
  • Note that anyone who wants to use this in their environment may want to add some validation of the parameters (e.g., the data set and variables exist).
  • Two macro parameters have been added to control the region size for the tag cloud.

%macro tagCloud(data = sashelp.shoes /* input data */
               ,where = 1            /* subset where clause */
               ,word = Subsidiary    /* class variable */
               ,weight = Sales       /* analysis variable */
               ,statistic = Sum      /* statistics to calculate */
               ,outfile = _webout    /* output fileref */
               ,width = 600px        /* width of the tag cloud */
               ,height = 450px       /* height of the tag cloud */
               );

As seen below, a macro variable is created to make the input SAS Server Page less cluttered. In this case the nl macro variable will contain the value of the streamDelim macro variable with the newline argument.

 %local nl;

Next we summarize the data. In the Stored Process example. this was embedded in the SAS Server Page using the dosubl function. While we could do that here, there is no need to. You could also add an option to the macro to specify that the data set has already been summarized.

 proc summary data = &data nway;
  class &word;
  var &weight;
  output out = cloud(drop=_type_ _freq_) &statistic = ;
 run;

Next call PROC STREAM with the desired options. Note that the BEGIN keyword is required as the first token after the PROC STREAM statement. Also note that instead of using %INCLUDE to include the SAS Server Page text, it is included inline. While I typically use %INCLUDE in order to maximize re-use, I wanted to illustrate this technique.

 proc stream outfile = &outfile quoting = both; 
 BEGIN

As mentioned above, assign the value for the nl macro variable so it can be used on each line of the input SAS Server Page text in order to have the raw HTML more nicely formatted. Note however that this is only really needed here to make the source more readable for debugging purposes.

%let nl = &streamDelim newline;

Just some standard HTML header.

&nl;<html>
&nl; <head>
&nl;  <title>Tag Cloud for the &statistic of &weight by &word</title>

Just as for the Stored Process example, we point to a Google api library for the JQuery pieces and we use the readfile facility to just copy the JQCloud JavaScript and Cascading Style Sheet into the generated output.

Note the use of the GoogleApiLib macro variable. That is set in my environment so that I can easily update the value and have the new value propagated without having to update all of my programs and SAS Server Pages.

&nl;  <script src="&GoogleApiLib/jquery/1.10.1/jquery.min.js"></script>
&nl;  <script src="&GoogleApiLib/jqueryui/1.10.3/jquery-ui.min.js"></script>
&nl; <style>
&nl; &streamDelim readfile srvrpgs(jqcloud.css);
&nl; </style>
&nl; <script>
&nl; &streamDelim readfile srvrpgs(jqcloud-1.0.3.js);
&nl; </script>
&nl; </head>
&nl; <body>

The fieldset tag is used the to provide the nice border with embedded text (on the border). So I need a div tag to specify the size of the region.

&nl;<div style = "float:left; width:&width; height:&height;">
&nl;<fieldset>
&nl;<legend style="font-size:70%;">
Tag Cloud for the &statistic of &weight by &word
</legend>

Now just as in the Stored Process example, define the region to contain the generated tag cloud.

&nl;<div id="cloudCanvas" style="width:&width; height:&height;"></div>

End the fieldset.

&nl;</fieldset></div>

And  since this is a batch process, lets use the generatedAt macro to provide a footnote showing when the output was created.

&nl;<div style="clear:both; font-size:70%;">%generatedAt()</div>

And finally, create the JSON text that populates the tag cloud - again, just as in the Stored Process example.

&nl;<script>
&nl; var tagCloud =
&nl; %tagCloudJSON(data=cloud
                  ,word=&word
                  ,weight=&weight
                  ,where=&where
                  )
&nl; $(function() {
&nl;   $("#cloudCanvas").jQCloud(tagCloud);
&nl; });
&nl;</script>
&nl; </body>
&nl;</html>
;;;;
%mend tagCloud;

That's really all there is to it.

And for those of you who want to download the code, I have a few more examples to blog about. Once I do that, I will package up all the pieces and parts (e.g., the AJAX container, the tag clouds SAS Server Pages, the macros, etc.) as a zip file.

And in case you had not noticed, I updated by blog template to make the text area wider so that the code is easier to read/follow. I hope you like the new format.

Wednesday, August 7, 2013

Tag Clouds vs. Pie vs. Bar Charts

When I was freshman in college I learned a lesson about making sure to emphasize important points. I got a C- on the very first paper I wrote as a college student. When I looked at the comments made by the Teaching Assistant (TA) who graded my paper, they were all very positive. In fact there were no comments at all to explain why I got the grade I got. When I asked the TA to tell me why he gave me a C-, he said that I made two mistakes. I did not meet the minimum pages requirement (my paper was 18 pages instead of 20); and I did not provide a summary. He gave me some advice about how to handle both issues in the future:
  • First, make sure to introduce the topic (i.e., talk about what you are going to talk about)
  • Next, discuss the topic (i.e., talk about it).
  • Last, summarize it (i.e., talk about what you just talked about).
So in that spirit let me summarize now my recent posts on Tag Clouds. One of my points was that Tag Clouds were a good way to display BI data in a meaningful way. Consider for example a Tag Cloud as originally described in this post:
vs. a Pie Chart
vs. a Bar Chart

on the same data (sashelp.shoes).

Don't know about you, but seems to me that the Tag Cloud does a much better job of displaying the data in a meaningful way.

In my next three posts I described:
And to re-emphasize the re-usability point, consider this example where I just specify a different form and get a different set of data presented in the Tag Cloud.

http://demos.hcsbi.com:8080/SASStoredProcess/guest?_program=/sspebook/sasServerPage&page=ajaxContainer&formUI=classform.html

In the not to distant future I will be blogging on another use of this AJAX template: a expanding/collapsing tree view of a summary data set:
Before that however I will digress a bit to talk about using PROC STREAM and SAS Server Pages in Base SAS to produce reports.

Monday, August 5, 2013

Tag Cloud SAS Server Page Components - Part 2 (of 2)

I recently posted about an AJAX and JQuery based Tag Cloud demo. I next described the re-usable AJAX template that is the foundation for the demo. In my last post I described two of the four component SAS Server Pages. This post completes the series with a description of:
  • tagCloud.html: the SAS Server Page that generates and displays the tag cloud (seen in left hand side of figure 1).
  • tagCloudJSON.sas: the SAS Macro the creates the JSON (JavaScript Object Notation) used to populate the tag cloud.
  • cloudDrill.sas: the SAS Macro that displays the drill-down results (seen in the right hand side of figure 1) when the user clicks on a word in the tag cloud.
Figure 1. Tag Cloud, including drill-down results.

The tagCloud SAS Server Page

The JQCloud JQuery widget is used to generate the tag cloud so we first have to define the style sheet and the JavaScript code to the page. Note the PROC STREAM readfile directive is used to do that. It simply includes the contents of the two files as is. Note that we could have also downloaded and put these files in our web server directory tree.

<html>
 <head>
  <style>&streamDelim readfile srvrpgs(jqcloud.css);</style>
  <script>&streamDelim readfile srvrpgs(jqcloud-1.0.3.js);</script>
 </head>


Next, we make sure that the parameters that define the tag cloud exist as macro variables and have default values.

 <body>
  %global data statistic word weight;
  %let data = %sysfunc(coalescec(&data,sashelp.shoes));
  %let statistic = %sysfunc(coalescec(&statistic,sum));
  %let word = %sysfunc(coalescec(&word,Subsidiary));
  %let weight = %sysfunc(coalescec(&weight,Sales));


In order to make the page completely stand-alone, the code to summarize the data and calculate the weight to apply to each word is executed using the dosubl function, invoked via the %sysfunc macro.

  %let rc = %sysfunc(dosubl(
               proc summary data = &data nway;
                class &word;
                var &weight;
                output out=cloud &statistic=;
               run;
            ));

Next a div tag is used to define the display area for the the tag cloud. And id value of cloudCanvas is used so the tagCloud plug-in can reference this area of the display. Note that the width, height, and border parameters could be parameterized using macro variables.

The newline directive is used (here and in the JavaScript below) to ensure that PROC STREAM does not insert a line break that could potentially cause problems. The use of the newline directive in this way should be considered a required Best Practice.

  &streamDelim newline;<div id="cloudCanvas" style="float:left;
                            width: 600px; height: 400px;
                            border: 1px solid #ccc; margin-bottom:5px">
                       </div>

The data for the tag cloud is specified in a JavaScript variable (called tagCloud) whose value is a JSON string (the macro that generates the JSON string is discussed below).

  &streamDelim newline;<script>
  &streamDelim newline; var tagCloud =

                             %tagCloudJSON
                                 (data=cloud
                                 ,word=&word
                                 ,weight=&weight
                                 )

Next is the JQuery syntax that says the the jQCloud JavaScript code should use the tagCloud variable as the source of the JSON used generate the display for the cloudCanvas div.

  &streamDelim newline; $(function() {
  &streamDelim newline;   $("#cloudCanvas").jQCloud(tagCloud);
  &streamDelim newline; });


Next is the JQuery syntax that detects when a word has been clicked on. Here, we call the cloudDrill macro and display the results using AJAX in the drillResults region of the screen.

  &streamDelim newline; $("#cloudCanvas").click(function(e) {
  &streamDelim newline;   var selected = $(e.target).text();
  &streamDelim newline;   $("#drillResults").load("&_url?_debug=&_debug%nrstr(&)_program=&_metafolder.runMacro%nrstr(&)macroToRun=cloudDrill%nrstr(&)data=&data%nrstr(&)class=&word%nrstr(&)word="+encodeURIComponent(selected));
  &streamDelim newline; });
  &streamDelim newline;</script>


And finally, is the definition of the area, with some default initial text, where the resulting drill down table is displayed.

  <div style="float:left;  margin-left:10px;" id="drillResults">
   <br>Click on a word/phase in the tag cloud to see the detail.
   The drill-down report will be displayed to the right of the

   Tag Cloud if there is enough horizontal space. Otherwise it
   will be displayed below the Tag Cloud.
  </div>
 </body>
</html>


That's all there is to it. While the JQuery syntax takes some getting used to; it really is fairly straightforward.

The tagCloudJSON Macro

A macro is used to read the data set and generate the needed JSON.

%macro tagCloudJSON
      (data = _last_
      ,where = 1
      ,word = word
      ,weight = weight
      );


The SCL data access functions are used via the %sysfunc macro function.

 %local dsid wordNum weightNum weightFmt comma;
 %let dsid = %sysfunc(open(&data(where = (&where))));
 %let wordNum = %sysfunc(varnum(&dsid,&word));
 %let weightNum = %sysfunc(varnum(&dsid,&weight));
 %let weightFmt = %sysfunc(varfmt(&dsid,&weightnum));


We loop through the data set reading each observation generating the needed JSON.
  • the text attribute is the value of the word (the class variable in SAS terminology).
  • the weight attribute is the unformatted value of the analysis variable.
  • And the html attribute is a nested JSON string the specifies that the hover text should be the formatted value of the analysis variable. And since the word is clickable, we make sure that the pointer attribute is used when the user hovers over a word.
The comma macro variable is set to blank initially and then reset so that each observations JSON is comma separated.

 %let comma=;
 &streamDelim newline;[

 %do %while(%sysfunc(fetch(&dsid))=0);
    &comma &streamDelim newline;
    {
      text:   "%qtrim(%qsysfunc(getvarc(&dsid,&wordnum)))"
    , weight: %qsysfunc(getvarn(&dsid,&weightNum))
    , html:   { title: "%qsysfunc(getvarn(&dsid,&weightNum),&weightFmt)"

              , style: "cursor:pointer"
              }
    }
    %let comma = ,;
 %end;


And finally, we close the data set and close the JSON string.

 %let dsid = %sysfunc(close(&dsid));
 &streamDelim newline; ];

%mend tagCloudJSON;

The cloudDrill Macro 

This macro is executed by the runMacro stored process whenever the user clicks on a word. Three parameters are passed to it:
  • The name of the data set (referenced here as &data) that provided the source data for the tag cloud.
  • The name of the class variable that is the value for the words (referenced here as &class).
  • The actual value the user clicked on (referenced here as &word).
Note also that the class variable is displayed in the PROC REPORT spanned header and so it is defined using the noprint define statement attribute so screen real estate is not used/wasted to display it on each row.

 %macro cloudDrill;
 options nocenter;
 proc report data = &data nowd split='_' missing;
  columns ("&Word" _all_);
  where &class = "&word";
  define &class / noprint;
  rbreak after / summarize;
 run;

%mend cloudDrill;

Summary

I hope that this all makes sense. If not, feel free to post a question.

I plan to use the AJAX template discussed here and in my last three posts in future blog posts that illustrate additional examples of what can be done. So please make sure to check them out.